Deep dive into the Model Explorer with calculation group authoring and creating relationships in the properties pane
The model view now has even more to offer! We are excited to share the public preview of the Model explorer in the model view of Power BI Desktop.
The Model explorer gives full visibility of the dataset, also known as semantic model, items in a single tree view. See what all has been done on your semantic model at-a-glance.
Model explorer boosts productivity when authoring semantic models in many ways.
- Quickly find the items you need to work on with the search bar.
- Focus your attention on the items you want by expanding and collapsing the tree view.
- Know how many of each semantic model item you already have.
- Single pane access to create or edit semantic model items.
Many of the semantic model items, none of which are new with the release of Model explorer, can already be created or edited within Power BI Desktop. These items are:
- Measures
- Relationships
- Roles
- Tables
For these items, you can create and edit them also from the Model explorer. Click on them to see their properties pane or right-click to see their context menu.
The Semantic model section has a new properties pane that allows you to see and adjust the model level properties.
The Relationships section also now has the option to create a new relationship in the properties pane. This gives the benefit of no queries running to fetch a data preview or validating the relationship as you click that you get with editing relationships in the properties pane but now also for creating a new relationship. The existing paths to create a relationship are still available, this just offers an additional way that may be most helpful to users with tables in DirectQuery or Direct Lake storage mode.
Some of these semantic model items do not have a direct way to create or edit them within Power BI Desktop. These items are:
- Cultures
- Perspectives
They can only be created or edited in Power BI Desktop via XMLA endpoints or XMLA-based tools such as SQL Server Management Studio (SSMS) or external tools like the Tabular Editor open-source community tool.
And finally, for one of these semantic model items we are introducing creating and editing within Power BI Desktop. We are very excited to announce the public preview of authoring the powerful calculation groups feature in Power BI Desktop.
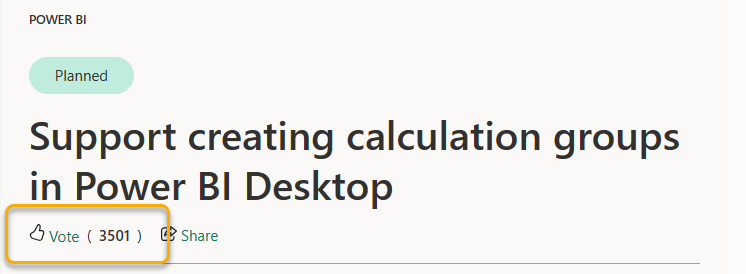
Support for creating calculation groups in Power BI Desktop has been a highly voted idea with over 3,500 votes. Thank you Marco Russo for the popular idea and your continuous support and amazing contributions in helping users understand DAX and modeling in Power BI!
To add a calculation group to your model, simply click the Calculation group button in the ribbon of model view.
A dialog will show letting you know your model will now discourage implicit measures when a calculation group is added. Click Yes to continue.
Implicit measures are when you drag a data column directly into a visual and the visual aggregates it as a SUM, AVERAGE, MIN, etc. Discourage implicit measures will not allow report creators to add data columns to visuals as aggregate values. Existing visuals with implicit measures will still show the values. Unfortunately, calculation items are not applied to implicit measures, which is why this setting is required. Calculation items only apply to measures, sometimes termed explicit measures. A measure is created by clicking on New measure in the ribbon and you define the DAX expression to aggregate a data column. You can also include conditional elements and filters when you aggregate a data column in a measure, giving you the full analytical capabilities DAX provides. Calculation items then apply their additional DAX expression logic on these measures.
When the calculation group is created the first calculation item is also automatically created and you can start typing the DAX expression in the DAX formula bar. This automatically created calculation item uses SELECTEDMEASURE(), which simply is the measure the calculation item is applied to without any modification, to get you started.
Here are some examples to get you going on creating calculation groups in your own models.
- Create a Daily Averages calculation group.
- Create a Time Intelligence calculation group.
- Create a Conversion calculation group.
To follow along with these examples, download the Adventure Works DW 2020 PBIX from https://aka.ms/dax-docs-samples. And as this feature is in public preview, you will need to turn on the feature in the Preview Features section of the Options in Power BI Desktop (there is a screenshot at the end of this blog post).
1) Create a Daily Averages calculation group. When looking at monthly or yearly values, it’s helpful to see what the daily or monthly averages were as well as just the totals. This is easily done with a couple new DAX measures for Orders.
Orders =DISTINCTCOUNT ( 'Sales Order'[Sales Order] )Orders: Daily Average =AVERAGEX ( VALUES ( 'Date'[Date] ), [Orders])Orders: Monthly Average =
AVERAGEX (
VALUES ( 'Date'[Month] ),
[Orders]
)
Unfortunately, if I wanted this on another measure, I would have to create two more measures again. And so on for each additional measure. Instead of creating additional measures, I can make two calculation items in a calculation group that then can be applied to any of the other measures.
- Go to Model view and create a new calculation group by clicking on Calculation group in the ribbon.
- Double click on the Calculation group and rename it to Averages
- Double click on the Calculation group column and rename it to Averages
- Double click on the Calculation item and rename it to Total. This is the one that was initially created and should be:
Total =
SELECTEDMEASURE () - Create a new calculation item by right-clicking on Calculation items (x) section and choosing New calculation item. Rename it to Daily average and have the DAX expression be:
Daily average =
AVERAGEX (
VALUES ( 'Date'[Date] ),
SELECTEDMEASURE ()
) - Create another new calculation item by right-clicking on Calculation items (#) section and choosing New calculation item. Rename it to Monthly average and have the DAX expression be:
Monthly average =
AVERAGEX (
VALUES ( 'Date'[Month] ),
SELECTEDMEASURE ()
) - To order the calculation items, click on the Calculation items (#) section and
order the calculation items in the properties pane.
- If you do not have any measures created on the model, create these measures by going to New measure in the ribbon.
Orders =
DISTINCTCOUNT ( 'Sales Order'[Sales Order] )Sales Amount =
SUM ( Sales[Sales Amount] ) - To see this calculation group in action, go to the Report view. Add a Matrix visual with Fiscal Year on Rows, Averages on Columns, and Orders (or any other measure) on Values.
- Now this calculation group’s calculation items can apply to any measure in your model!
2) Create a Time Intelligence calculation group. A common scenario when I have data with dates and a Date table in my model is to show them in different time contexts. These are usually termed Time Intelligence. “Time” in this case is in the general over time context of days, months, quarters, and years, not “Time” as hours and minutes. DAX has many Time Intelligence functions available to use. Find all the DAX time intelligence functions at Time intelligence functions (DAX) – DAX | Microsoft Learn. Here we can create a subset of common ones in a calculation group to get you started.
- Go to Model view and create a new calculation group by clicking on Calculation group in the ribbon.
- Double click on the Calculation group and rename it to Time Intelligence.
- Double click on the Calculation group column and rename it to Show as.
- Double click on the Calculation item and rename it to Current. This is the one that was initially created and should be:
Current =
SELECTEDMEASURE () - Create a new calculation item by right-clicking on Calculation items (x) section and choosing New calculation item. Rename it to MTD and have the DAX expression be:
MTD =
CALCULATE (
SELECTEDMEASURE (),
DATESMTD ( 'Date'[Date] )
) - Repeat step 5 for these calculation items:
QTD =
CALCULATE (
SELECTEDMEASURE (),
DATESQTD ( 'Date'[Date] )
)YTD =
CALCULATE (
SELECTEDMEASURE (),
DATESYTD ( 'Date'[Date] )
)PY =
CALCULATE (
SELECTEDMEASURE (),
SAMEPERIODLASTYEAR ( 'Date'[Date] )
)PY MTD =
CALCULATE (
SELECTEDMEASURE (),
SAMEPERIODLASTYEAR ( 'Date'[Date] ),
'Time Intelligence'[Show as] = "MTD"
)PY QTD =
CALCULATE (
SELECTEDMEASURE (),
SAMEPERIODLASTYEAR ( 'Date'[Date] ),
'Time Intelligence'[Show as] = "QTD"
)PY YTD =
CALCULATE (
SELECTEDMEASURE (),
SAMEPERIODLASTYEAR ( 'Date'[Date] ),
'Time Intelligence'[Show as] = "YTD"
)YOY =
SELECTEDMEASURE ()
- CALCULATE (
SELECTEDMEASURE (),
'Time intelligence'[Show as] = "PY"
)YOY% =
DIVIDE (
CALCULATE (
SELECTEDMEASURE (),
'Time Intelligence'[Show as] = "YOY"
),
CALCULATE (
SELECTEDMEASURE (),
'Time Intelligence'[Show as] = "PY"
)
) - You should see your calculation group looking like this:
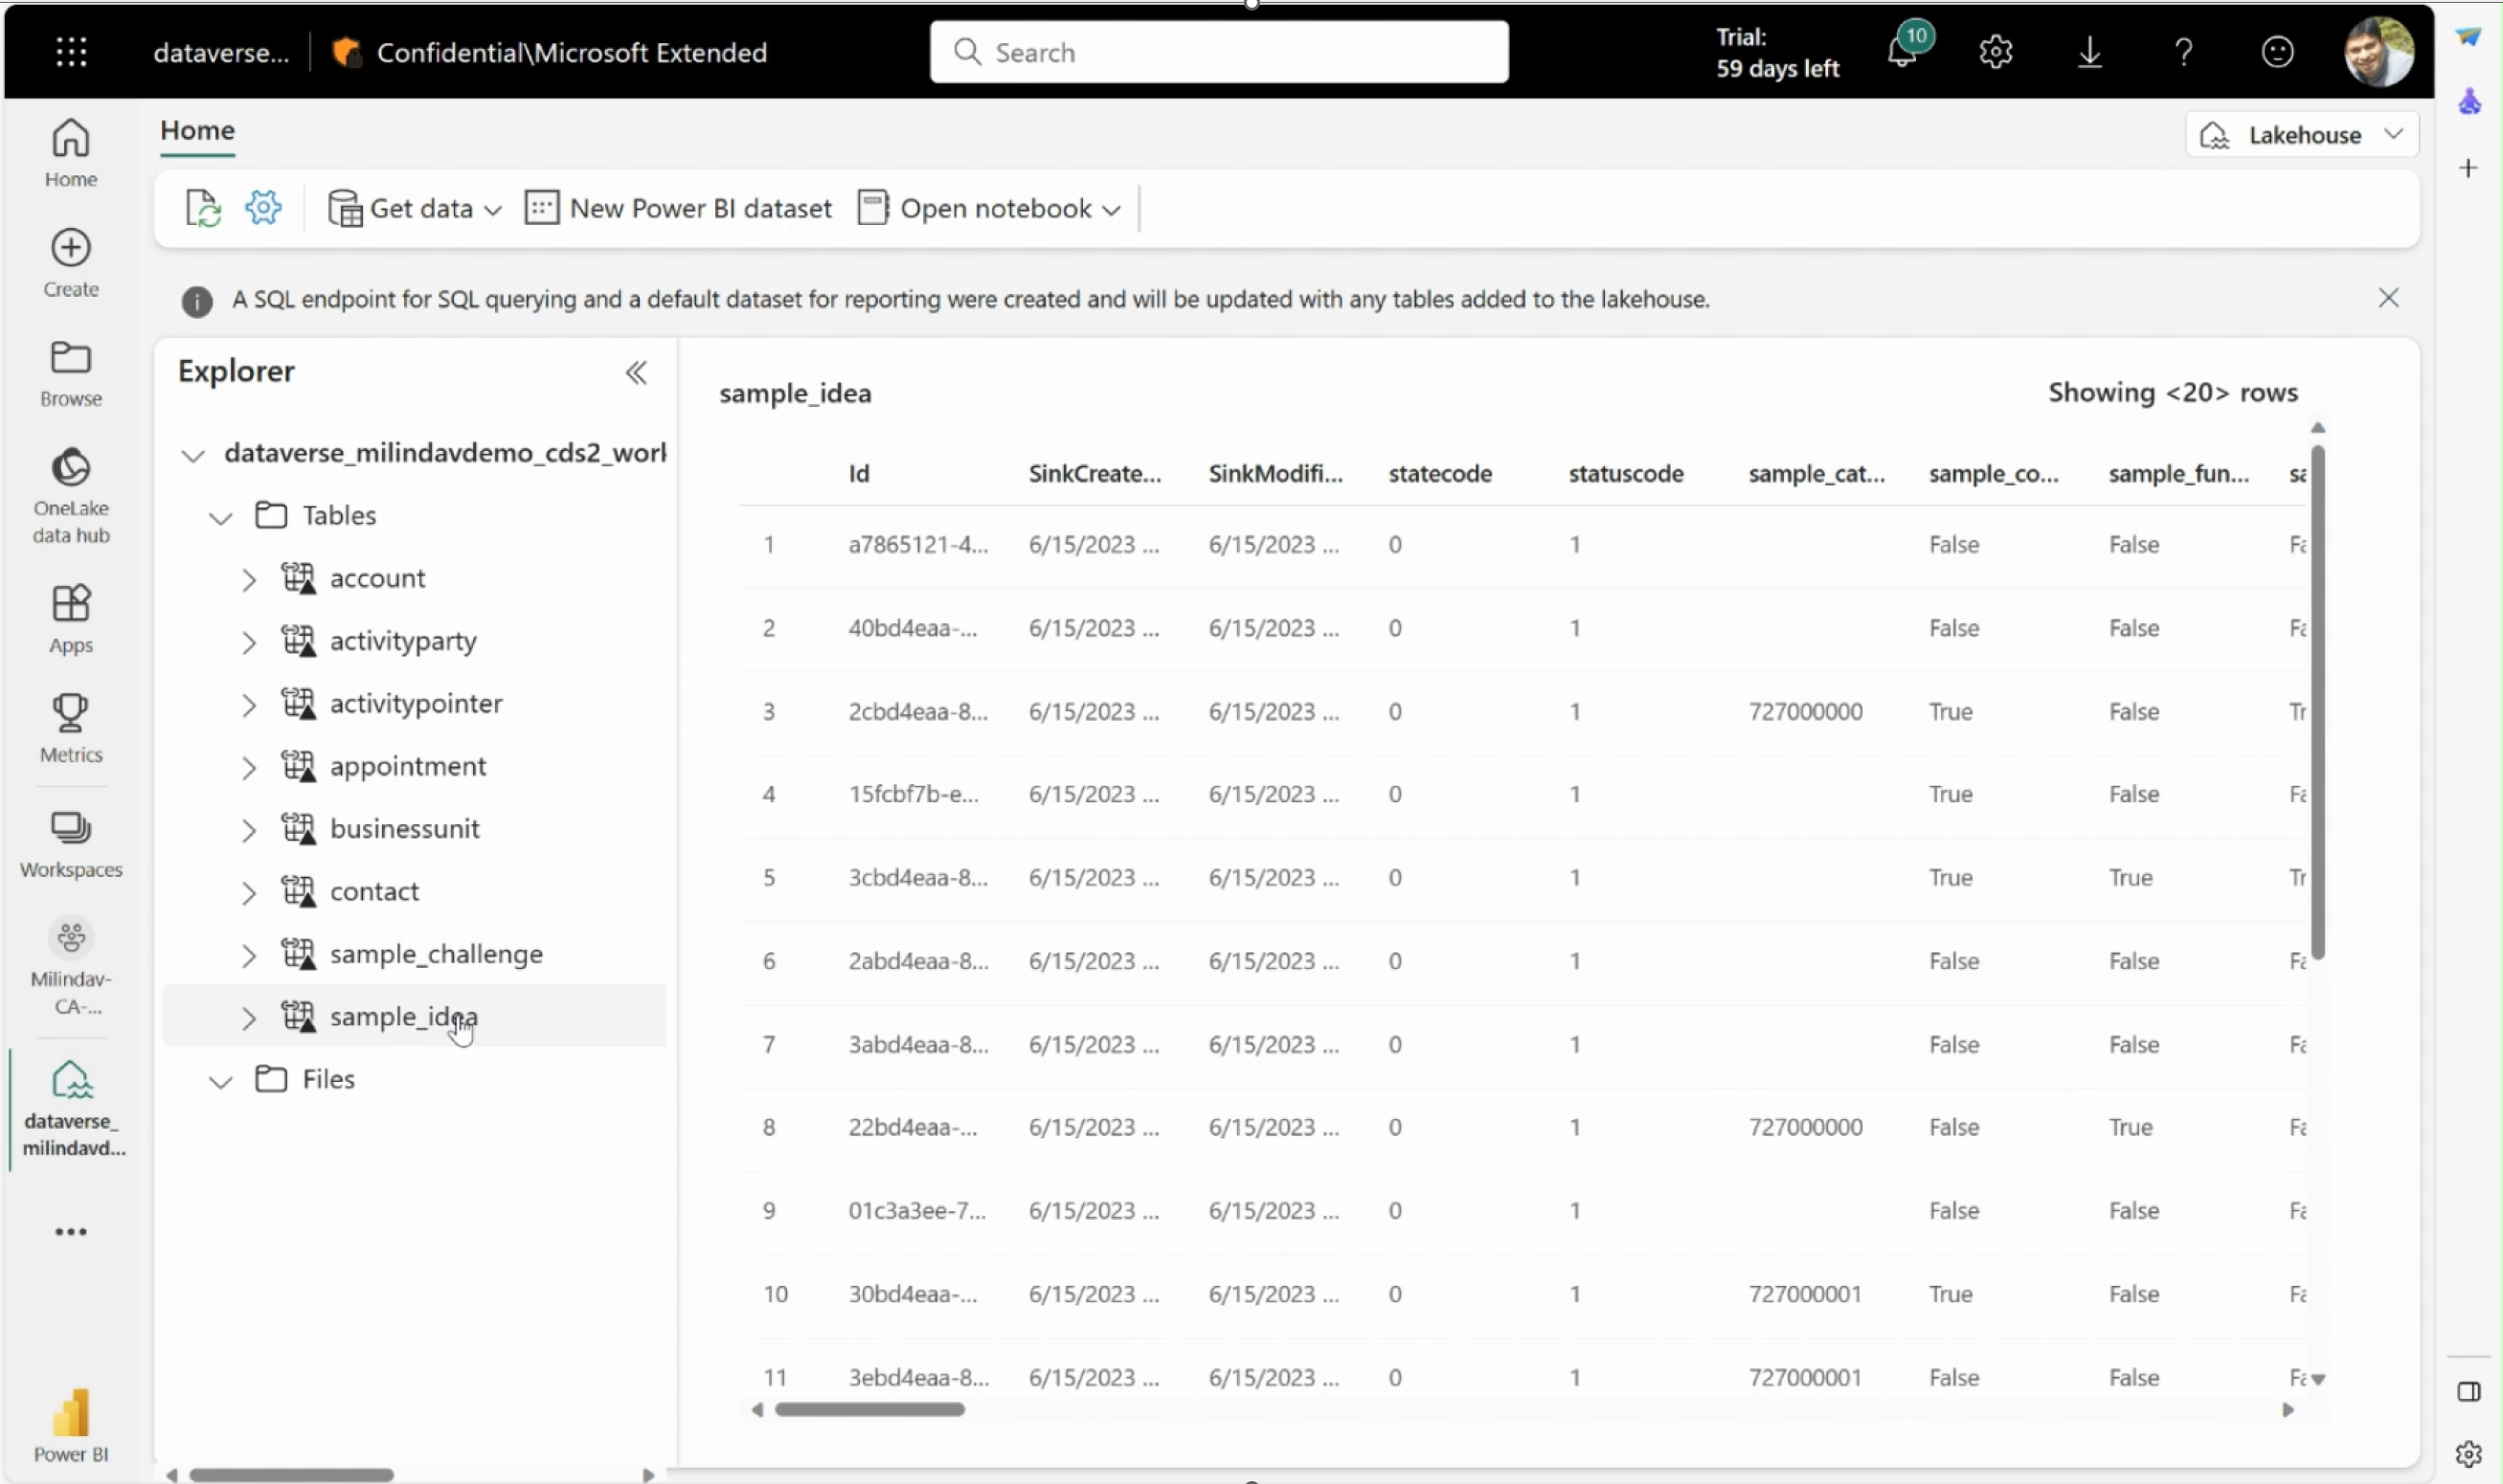
- When created the calculation items will order alphabetically. The order can be changed by clicking on the Calculation items (#) section and reordering them in the properties pane.
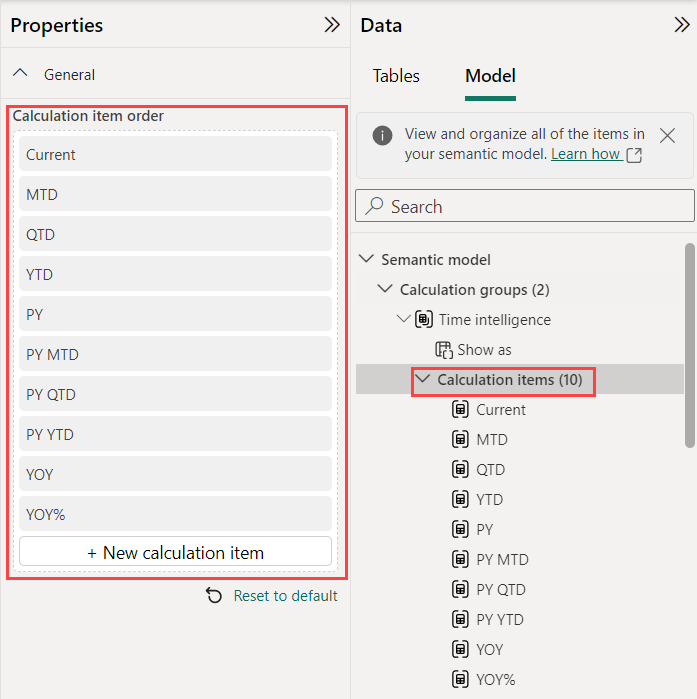 You can also use the calculation item context menu to move them up, down, to the top, or to the bottom.
- Finally, the calculation items use the underlying measure format to display in the visuals. For the YOY% calculation item it is preferrable to show this as a percentage instead. Click on YOY% and toggle on the Dynamic format string in the properties pane. For the Dynamic format string DAX expression this can include conditional or filter logic, but for this calculation item we just specify that it’s always like a percentage with the format string
"#,##0.00%".
- If you do not have any measures created on the model, create these measures by going to New
measure in the ribbon.Orders =
DISTINCTCOUNT ( 'Sales Order'[Sales Order] )Sales Amount =
SUM ( Sales[Sales Amount] ) - To see this calculation group in action, go to the Report view . Add a
Matrix visual with Month on Rows, Show as on Columns, and Orders (or any other measure) on Values. 3) Create a Conversion calculation group. Another common scenario with financial reports is showing the currency converted to other country currencies by multiplying the base currency by an exchange rate. This also takes advantage of the dynamic format stings of calculation items to show the converted currency also in the correct currency format. Calculation items can have the conversion DAX expression defined once that can be applied to the many measures in the model showing currency values, without the need to edit or duplicate many measures.
- Go to Model view and create a new calculation group by clicking on Calculation group in the ribbon.
- Double click on the Calculation group and rename it to Currency conversion
- Double click on the Calculation group column and rename it to Show as
- Double click on the Calculation item and rename it to No conversion (USD). This is the one that was initially created and should be:
No conversion (USD) =
SELECTEDMEASURE () - Create a new calculation item by right-clicking on Calculation items (x) section and choosing New calculation item. Rename it to Conversion (AVG) and have the DAX expression be:
Conversion (AVG) =
VAR _rate =
CALCULATE (
AVERAGE ( 'Currency Rate'[Average Rate] ),
CROSSFILTER ( 'Date'[DateKey], 'Currency Rate'[DateKey], BOTH )
)
RETURN
SELECTEDMEASURE () * _rate - Create a new calculation item by right-clicking on Calculation items (x) section and choosing New calculation item. Rename it to Conversion (EOD) and have the DAX expression be:
Conversion (EOD) =
VAR _rate =
CALCULATE (
AVERAGE ( 'Currency Rate'[End Of Day Rate] ),
CROSSFILTER ( 'Date'[DateKey], 'Currency Rate'[DateKey], BOTH )
)
RETURN
SELECTEDMEASURE () * _rate - When created the calculation items will order alphabetically. The order can be changed by clicking on the Calculation items (#) section and reordering them in the properties pane. For this example the alphabetical ordering is ok.
- The formatting for the two conversion calculation items can changed to match the country selected too. Click on Conversion (EOD) and in the properties pane toggle on dynamic format string and enter this DAX expression:
SELECTEDVALUE (
'Currency'[Format String],
""
) - Add the same DAX expression for the Conversion (AVG) dynamic format string too.
- Add some measures to your model, if you don’t have them already, by clicking New measure in the ribbon.
Sales Amount =
SUM ( Sales[Sales Amount] )Extended Amount =
SUM ( Sales[Extended Amount] ) - In Report view you can see this in a Matrix visual. Add Code, Currency, and Format string to the Rows, Show as to the Columns, and Sales
Amount and Extended Amount to the Values.
Now let’s explore some additional scenarios to take it to the next level. These show you how to get around any pitfalls and also take full advantage of the calculation groups.
1) I have a measure I want to calculation item ignore and not modify. Especially in the case of measures created to generate title text for use in visuals, there are measures you may want the calculation item to ignore. Visuals may result in error if the calculation item tries to do mathematical operations on a text measure. And in the case of the currency conversion, you may want it to only apply the conversion to currency measures and ignore other measures such as order counts. You can account for these cases in the calculation item DAX expression.
- I created a field parameter with three measures, Sales Amount, Extended Amount, and Orders. Learn more at https://learn.microsoft.com/power-bi/create-reports/power-bi-field-parameters.
- To know which one is selected in the visual, I created a text measure and added it to the visual title. Learn more at https://learn.microsoft.com/power-bi/create-reports/desktop-conditional-format-visual-titles.
Title for Conversion =
SELECTEDVALUE ( Parameter[Parameter Fields] ) & " Conversion table" - I then added the Conversion calculation group column, Show as, to a Slicer visual on the report page.
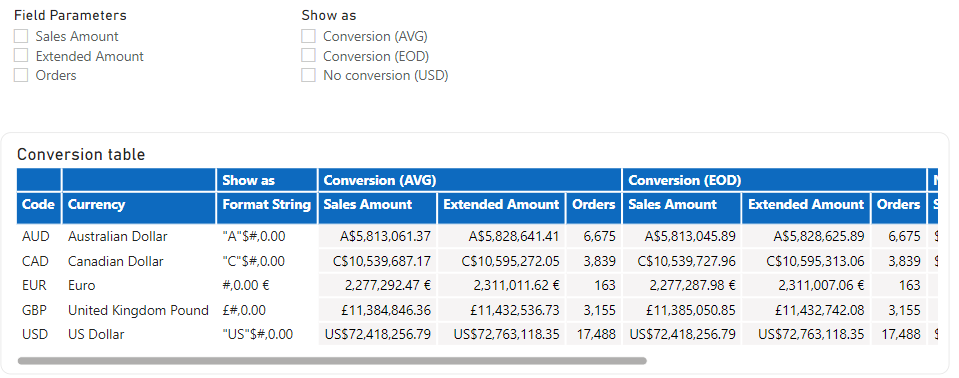
- But when I pick a currency conversion, the Title for Conversion on the visual will show an error. This is because the calculation item is expecting all measures, including the title text measure, to be numeric.
- Also, when if I pick Orders, it will convert Orders, which is not intended.
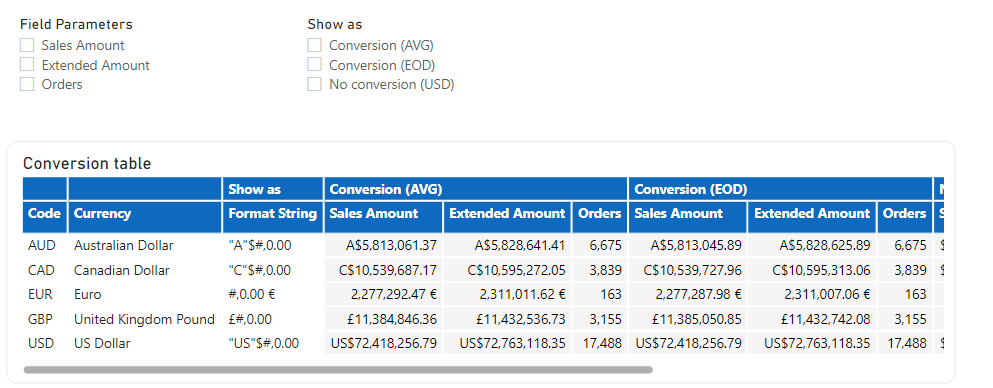
- To fix this, I modify my calculation items and their dynamic format string DAX expression. In my model all my currency data type measures have the word “Amount” in the measure name. So, I can alter my calculation group DAX expression to only work if the measure it’s going to apply to has “Amount” in the name.
Conversion (AVG) =
VAR _rate =
CALCULATE (
AVERAGE ( 'Currency Rate'[Average Rate] ),
CROSSFILTER ( 'Date'[DateKey], 'Currency Rate'[DateKey], BOTH )
)
RETURN
// if the measure name contains "Amount"
IF (
SEARCH (
"Amount",
SELECTEDMEASURENAME (),
1,
-1
) > -1,
// convert it
SELECTEDMEASURE () * _rate,
// otherwise leave it alone
SELECTEDMEASURE ()
) - And also in the dynamic format string DAX expression:
// if the measure name contains "Amount"
IF (
SEARCH (
"Amount",
SELECTEDMEASURENAME (),
1,
-1
) > -1,
// Format it like a currency of the selected country
SELECTEDVALUE (
'Currency'[Format String],
""
),
// Else leave the formatting alone
SELECTEDMEASUREFORMATSTRING ()
) - And similarly for the other Conversion calculation item:
Conversion (EOD) =
VAR _rate =
CALCULATE (
AVERAGE ( 'Currency Rate'[End Of Day Rate] ),
CROSSFILTER ( 'Date'[DateKey], 'Currency Rate'[DateKey], BOTH )
)
RETURN
// if the measure name contains "Amount"
IF (
SEARCH (
"Amount",
SELECTEDMEASURENAME (),
1,
-1
) > -1,
// convert it
SELECTEDMEASURE () * _rate,
// otherwise leave it alone
SELECTEDMEASURE ()
) - And its dynamic format string is the same.
// if the measure name contains "Amount"
IF (
SEARCH (
"Amount",
SELECTEDMEASURENAME (),
1,
-1
) > -1,
// Format it like a currency of the selected country
SELECTEDVALUE (
'Currency'[Format String],
""
),
// Else leave the formatting alone
SELECTEDMEASUREFORMATSTRING ()
) - So now I get exactly what I was expecting from my Conversion calculation group. Orders measure is unaffected:
- And the text measure used for the visual title is also unaffected.
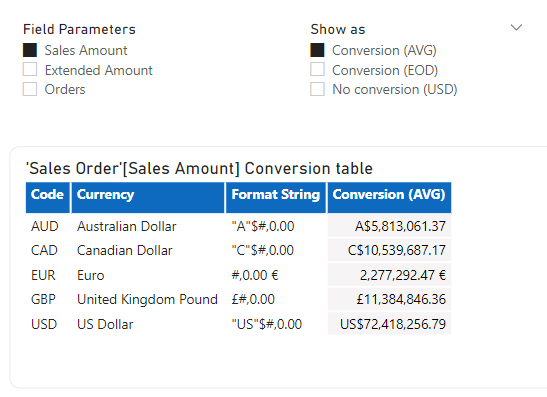
2) I want to create a measure with the calculation item applied. Sometimes it’s preferred to have the DAX pattern in a calculation item and still create the duplicate measures in my model. This way I only have to modify the DAX pattern logic once in the calculation item and all the measures depending on it will be updated. You can use the calculation item as part of a larger DAX expression for a measure or even another calculation item, like you saw in the Time Intelligence example. To apply a calculation item to a specific measure as a new measure, simply add the FILTER context.
For example, take Sales Amount. This is a SUM of the Sales Amount column.
Sales Amount =SUM ( Sales[Sales Amount] )I can create a Sales Amount YTD measure by using the Time Intelligence YTD calculation item.
Sales Amount YTD =CALCULATE ( [Sales Amount], 'Time intelligence'[Show as] = "YTD")These are just the start of how you can utilize calculation groups. There are many more examples out there in the community on how to use calculations groups. I would love to hear how you use calculation groups in your models!
Try model explorer and calculation groups starting today! Be sure to turn on the feature in the Preview Features section of the Options in Power BI Desktop, and comment with any feedback!
And learn more about these features in our documentation:
- Model explorer: https://learn.microsoft.com/power-bi/transform-model/model-explorer
- Calculation group authoring: https://learn.microsoft.com/power-bi/transform-model/calculation-groups
- Calculation groups: https://aka.ms/calculationgroups


