Data Warehouse Utilization Reporting in Fabric Capacity Metrics App


As announced today, we are excited to share that compute utilization reporting for Synapse Data Warehouse features: Warehouse and SQL Endpoint of the Lakehouse are now available in Public Preview for Microsoft Fabric in all regions!
In the capacity-based SaaS world of Microsoft Fabric, you can purchase a Fabric SKU which comes with a set of Capacity Units (CU). Back in June 2023 we announced the availability of Fabric SKUs. Workspaces are assigned to capacities and everything inside a workspace such as Warehouse, Lakehouse, Dataset, etc., consume capacity units based on consumption.
Similar to the rest of Fabric landscape, Warehouse compute also supports bursting capabilities for maximum performance. The bursting will be based on the SKU purchased (more details coming soon).
Warehouse and SQL Endpoint in Fabric Metrics app
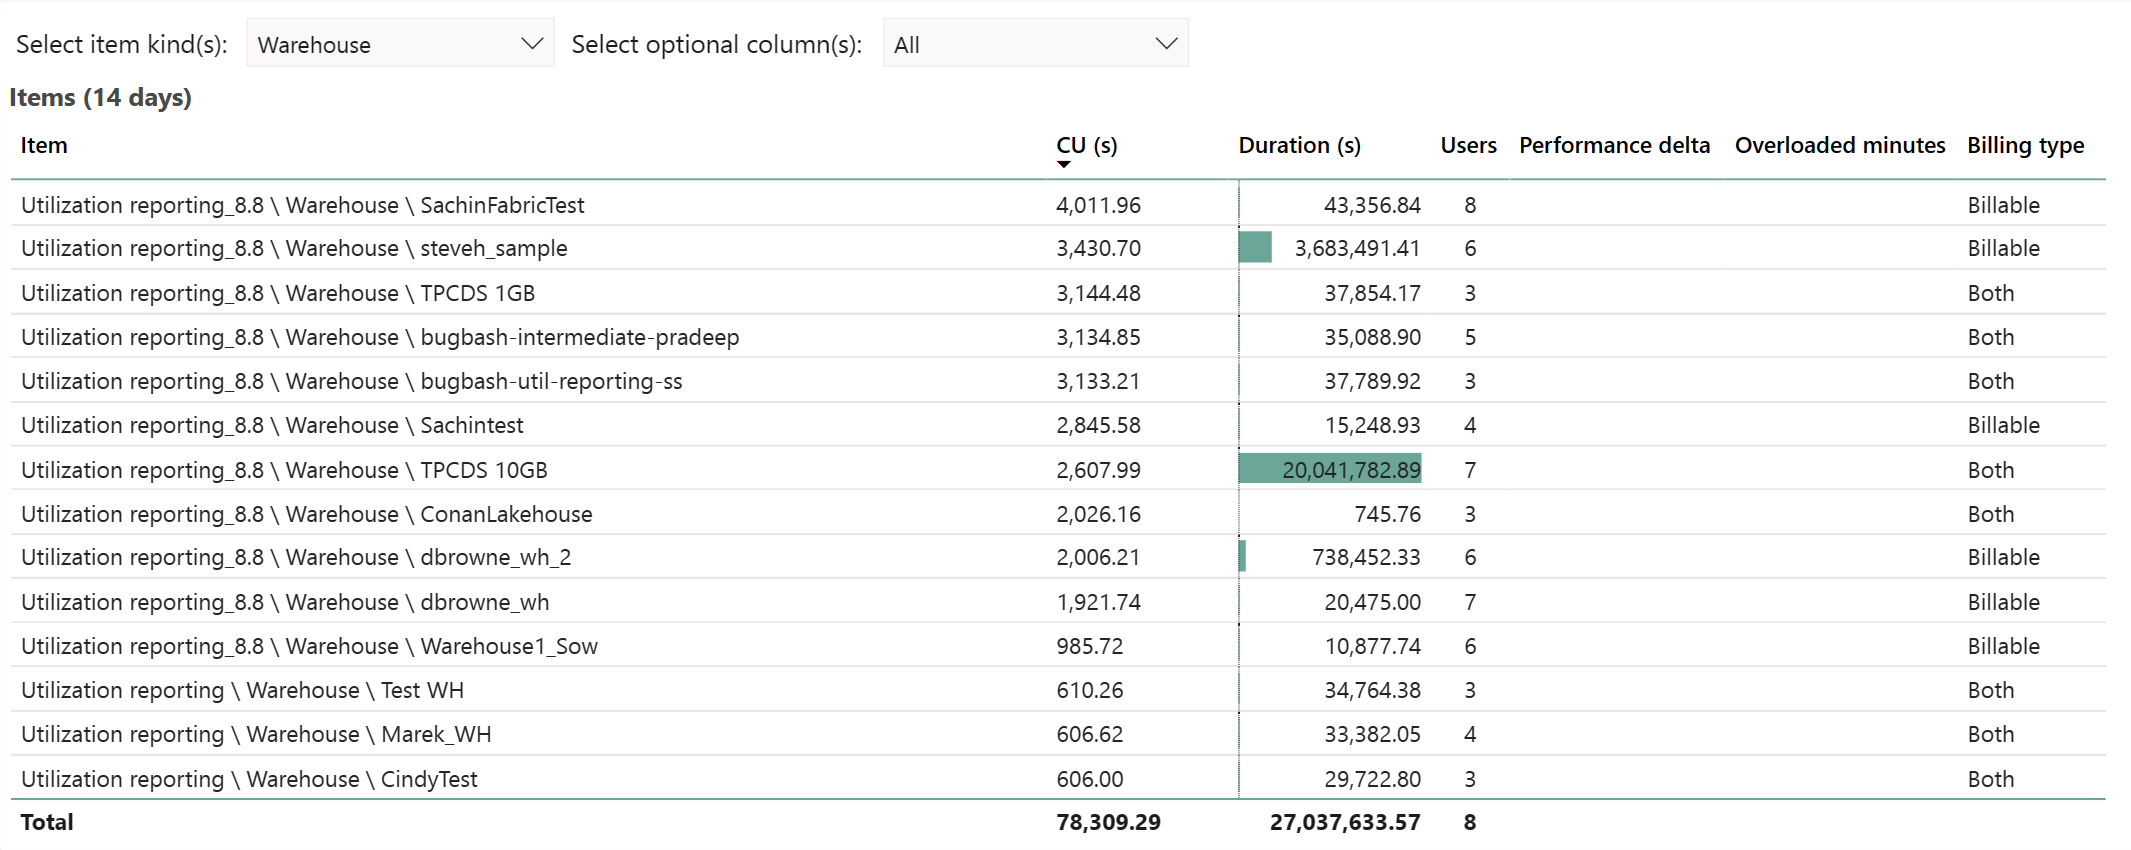
The Microsoft Fabric Capacity Metrics app provides visibility into capacity usage for all Fabric workspaces tied to a capacity. It is used by capacity administrators to monitor the performance of workloads and their usage, compared to purchased capacity. Consider the following use cases:
- Identify CU usage trends across warehouse items within a capacity.
- Monitor overload information, and drill through specific timepoints to identify users/operations causing spikes.
Warehouse operation categories
Both Data Warehouse and SQL endpoint items roll up under “Warehouse” in Metrics app, as they both use SQL compute.
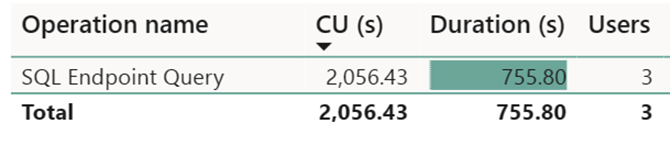
The operation categories seen in this view are:
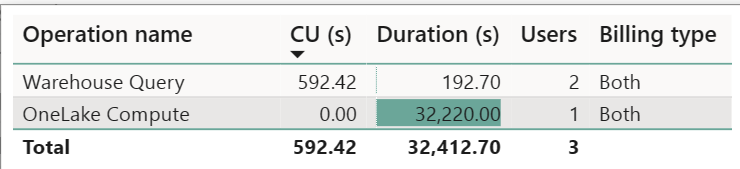
1. Warehouse Query: Compute charge for all user generated and system generated T-SQL statements within a warehouse.
2. SQL Endpoint Query: Compute charge for all user generated and system generated T-SQL statements within a SQL Endpoint.
3. Onelake Compute: Compute charge for all reads and writes for data stored in OneLake.
Timepoint – Explore graph
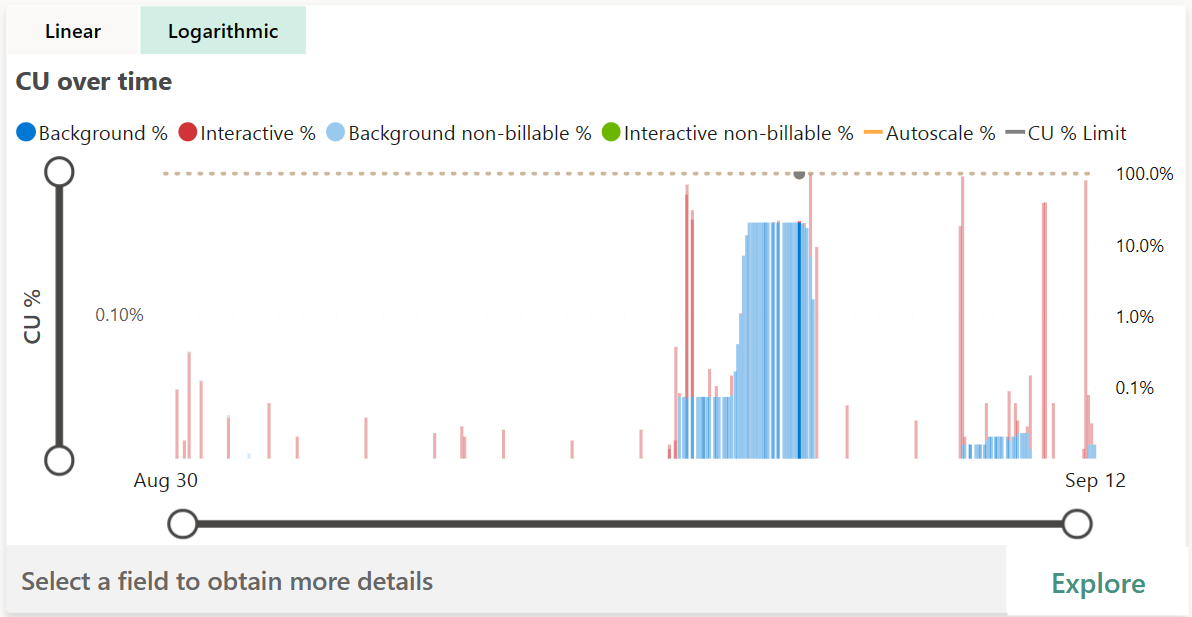
This graph in the Microsoft Fabric Capacity Metrics app shows utilization of resources compared to capacity purchased. 100% of utilization represents the full throughput of a capacity SKU and is shared by all Fabric experiences. This is represented by the yellow dotted line. The Logarithmic scale option enables the Explore button, which opens a detailed drill through page.
In general, operations are classified either as interactive or background, and denoted by color. All operations in Warehouse category are reported as background to take advantage of 24 hour smoothing of activity to allow for the most flexible usage patterns.
Timepoint – Drill through graph
This table in the Microsoft Fabric Capacity Metrics app provides a detailed view of utilization at specific timepoints. The amount of capacity provided by the given SKU per 30-second period is shown, along with the breakdown of interactive and background operations.
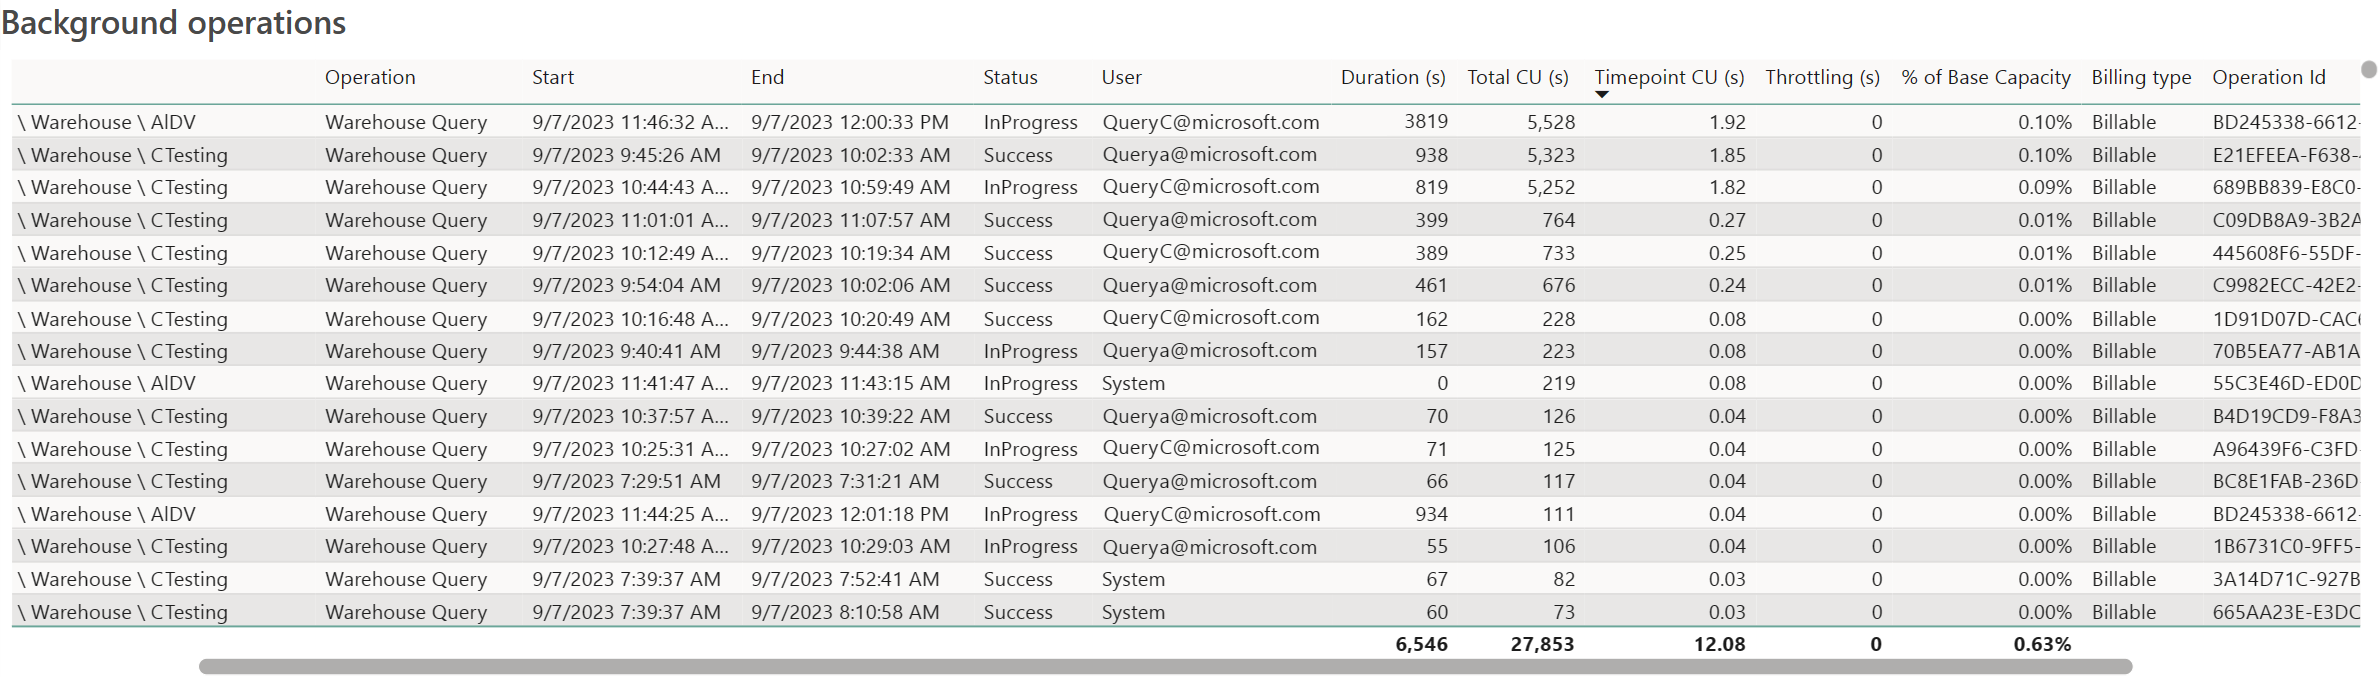
Top use cases for this view include:
- Identification of a user who scheduled or ran an operation: values can be either “User@domain.com”, “System”, or “Power BI Service”.
- Examples of user generated statements include running T-SQL queries or activity in the Fabric portal, such as the SQL Query editor or Visual Query editor.
- Examples of “System” generated statements include metadata synchronous activities and other system background tasks that are run to enable faster query execution.
- Identification of an operation status: values can be either “Success”, “InProgress”, “Cancelled”, “Failure”, “Invalid”, or “Rejected”.
- The “Cancelled” status are queries cancelled before completing.
- The “Rejected” status can occur because of resource limitations.
- Identification of an operation that consumed many resources: sort the table by Total CU(s) descending to find the most expensive queries, then use Operation Id to uniquely identify an operation. This is the distributed statement ID, which can be used in other monitoring tools like dynamic management views (DMVs) for end-to-end traceability, such as in
dist_statement_idin sys.dm_exec_requests.
For more information on Fabric warehouse usage reporting, please check out our documentation Billing and utilization reporting.

